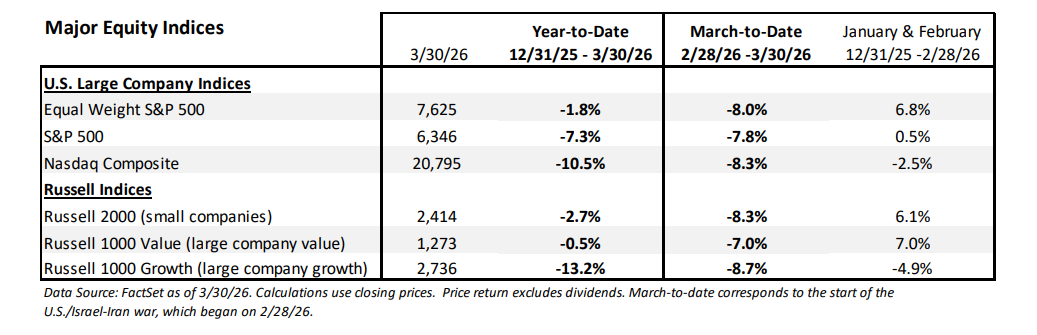
The Iran War injected an unexpected shock to markets in March, driving surging oil prices and interest rates, and steep declines in equities. Through Monday 3/30/26, the S&P 500 equity index was down -7.8% in March to-date, taking the year-to-date (YTD) decline to -7.3%. The S&P 500 decrease extended for five consecutive weeks, and other prominent equity indices were lower as well. The war has added risk to financial markets, as investors consider roadblocks to economic growth caused by oil prices, supply chain disruptions, higher interest rates, and the U.S. budget. At a minimum, as the war duration reaches four weeks, we expect disruption to the global economy, which can limit U.S. economic growth and pressure corporate earnings. However, we still see a window for an opening of the Strait of Hormuz, and potential ceasefire in April, which would help to limit economic damage and allow for U.S. equities to establish lows and move higher. An extended conflict that pushes through April, into May and June, increases the potential for a global and U.S. recession, which would likely weigh on equities, extending the recent correction.
We expect recent volatility to continue as uncertainty remains, but we advise most investors to stay the course and remain invested in high quality companies in portfolios that are broadly diversified across sectors. In our view, the Trump Administration has a strong incentive to end the war sooner rather than later, as positive developments would help to stabilize markets and interest rates and reduce uncertainty in a midterm election year. Of course, that might be easier said than done, as market weakness in late March accelerated, but the potential for a pivot to end the war keeps us from becoming decidedly negative as we remain within the Administration’s 4 to 6 week initial time estimate, and recent commentary has discussed a process that takes “weeks, not months.” Our S&P 500 fair value estimate of 7,100 (established in January) remains in place and now is +12% above current levels. But we also have a trading range of 6,000 to 7,500, with the low end of the range about -5% below the 3/30/26 level.
Continue reading our Market Strategy commentary.
CLICK HERE
Important Disclosure: Information contained herein has been obtained by sources we consider reliable but is not guaranteed and we are not soliciting any action based upon it. Any opinions expressed are based on our interpretation of the data available to us at the time of the original publication of the report. These opinions are subject to change at any time without notice. Investors must bear in mind that inherent in investments are the risks of fluctuating prices and the uncertainties of dividends, rates of return, and yield. Investors should also remember that past performance is not necessarily an indicator of future performance and D.A. Davidson & Co makes no guarantee, expressed or implied to future performance. Investors should consult their Financial and/or Tax Advisor before implementing any investment plan.
Market Indices: The information on indices is presented for illustrative purposes only and is not intended to imply the potential performance of any fund or investment. Indices provide a general source of information on how various market segments and types of investments have performed in the past. Index performance assumes the reinvestment of all distributions, but does not assume any transaction costs, taxes, management fees, or other expenses. You may not invest directly in an index. Past performance is not an indicator of future results. The S&P 500 Index is a market cap weighted index that is designed to measure the US large-cap equity performance. The index is composed of the 500 leading publicly traded US companies based on size, liquidity, industry, and profitability criteria. The Dow Jones Industrial Average is a price weighted index that tracks 30 large, publicly owned companies trading on the New York Stock Exchange (NYSE) and the NASDAQ. The Russell 2000® Index is a market cap weighted index that measures the performance of the 2,000 smallest companies in the Russell 3000® Index. The Russell 1000 Growth index includes the Russell 1000 companies that exhibit relatively higher price-to-book ratios, and higher expected earnings and sales growth. The Russell 1000 Value index includes the Russell 1000 companies that exhibit relatively lower price-to-book ratios and lower than average expected earnings and sales growth. The S&P 500 Equal Weight Index is the equal-weight version of the S&P 500, which is weighted by market capitalization. In the Equal Weight version, each company is assigned an equal weight, about 0.2%, and is rebalanced quarterly.