Davidson Investment Advisors’ first-quarter commentary provides insights into the U.S. equity, taxable fixed income, municipal fixed income, and international equities markets.
U.S. Taxable Fixed Income Market
Geopolitics and the Price of Uncertainty
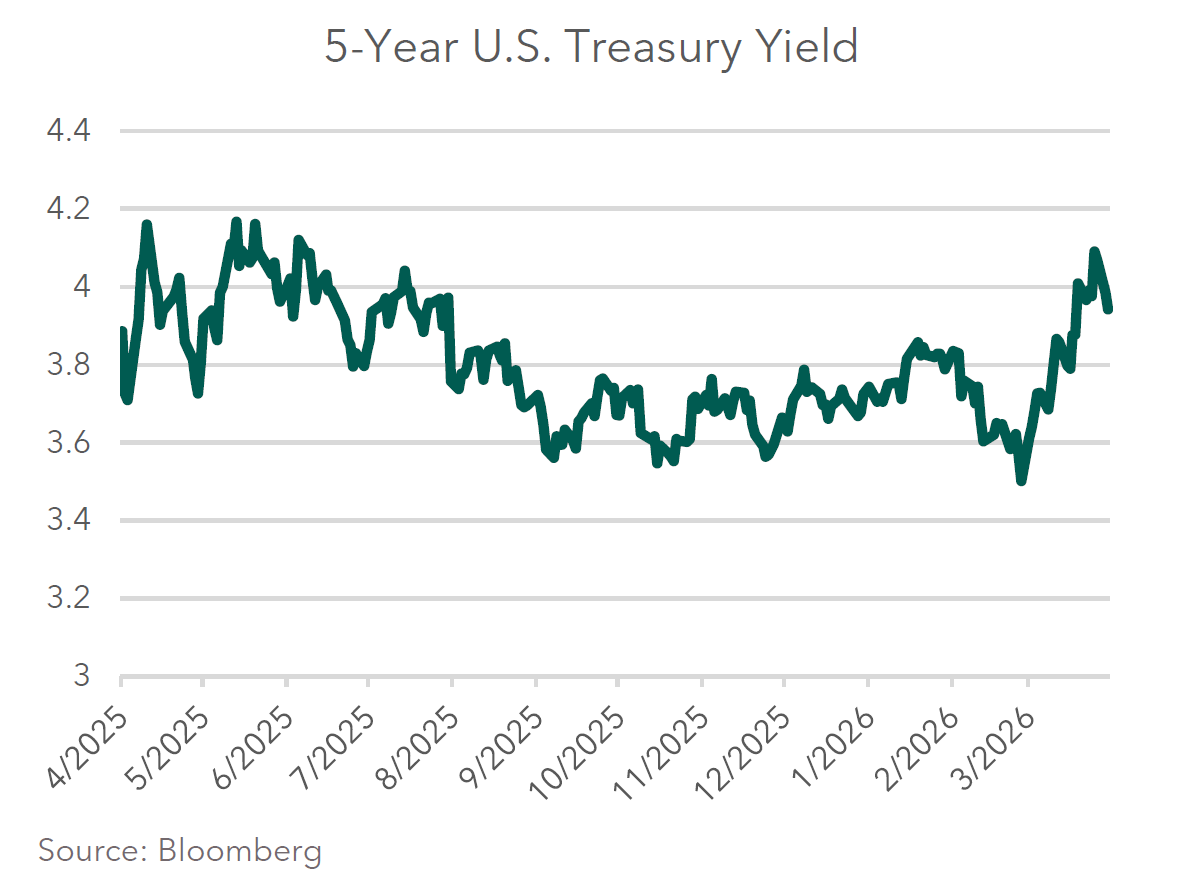
In the first quarter of 2026, taxable fixed income was shaped less by domestic economic data and more by events unfolding well beyond U.S. borders. Intermediate bonds, as measured by the Bloomberg Intermediate U.S. Government/Credit Index, declined 0.02% for the quarter, as higher rates and modestly wider credit spreads weighed on performance. Short- and intermediate-term yields moved higher, with the 5-year U.S. Treasury yield rising from 3.73% at year-end to 3.94% by quarter-end, serving as a useful proxy for the repricing of the front and belly of the curve. What had been expected to be a quarter of falling rates instead became a reminder that even intermediate bonds remain sensitive to shifts in inflation expectations and policy outlooks.
Geopolitics was the dominant macro theme of the quarter. While developments in Greenland and Venezuela drew attention, events surrounding Iran proved most consequential for global markets. Escalating tensions and the effective closure of the Strait of Hormuz raised the specter of a sustained oil supply shock, driving energy prices higher and reviving inflation concerns. While a resolution to the conflict appears possible from today’s vantage point, both timing outcome remain uncertain, leaving energy markets — and inflation expectations — vulnerable to further disruption.
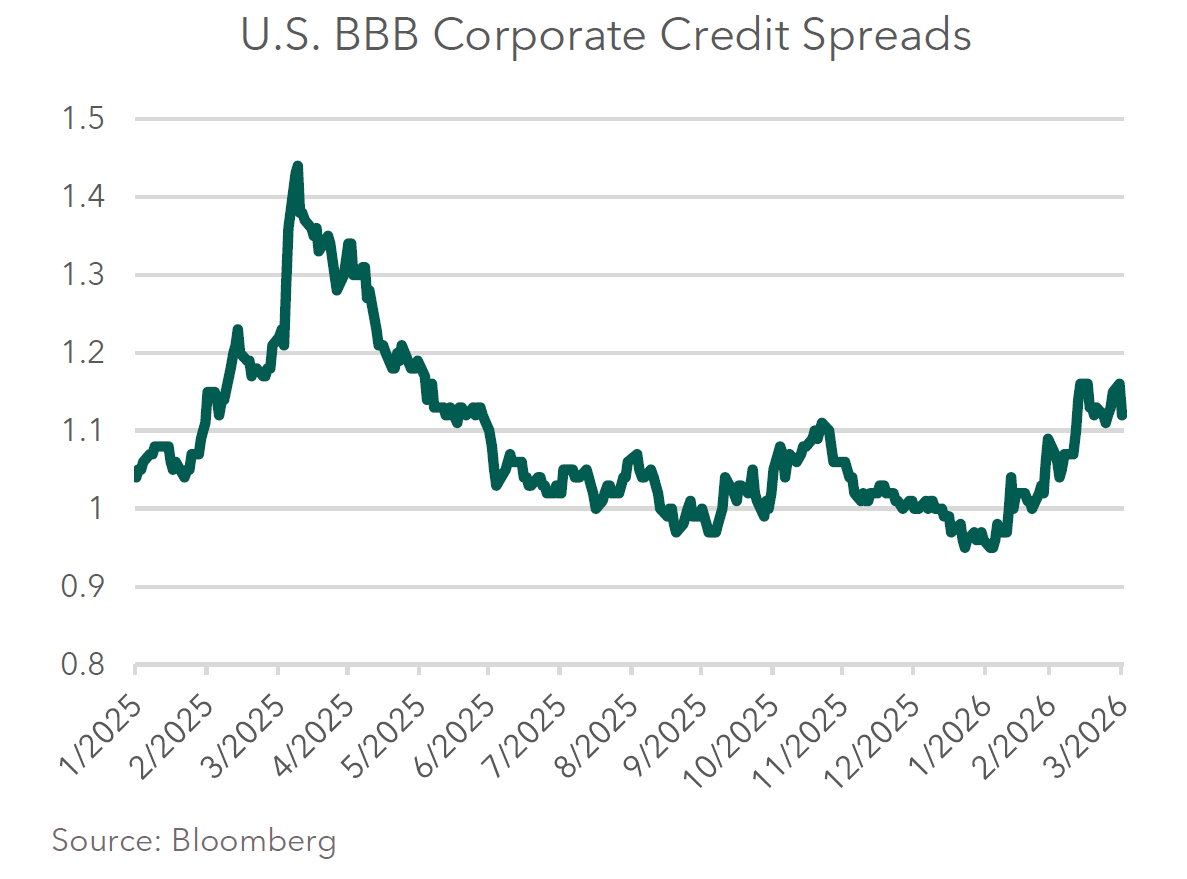
The impact of these concerns was visible in credit markets. Corporate credit spreads widened modestly over the quarter, with BBB-rated bonds expanding from roughly 1.00% over comparable Treasuries at year-end to approximately 1.16% by quarter-end. At the same time, market expectations for Federal Reserve policy shifted meaningfully. Entering the year, investors anticipated several rate cuts in 2026; by the end of March, expectations had moved toward Fed inaction. Even so, intermediate interest rates remain within the broad trading range established over the past three years — a range that increasingly reflects growing unease about the durability of economic growth rather than fears of runaway inflation alone.
Beneath the surface, concerns around liquidity and private credit also gained prominence. Isolated instances of gating and redemption limitations reminded investors that liquidity in private markets can disappear precisely when it is most needed. These developments sparked renewed debate about valuation transparency, risk premiums, and the role private credit should play alongside publicly traded bonds, particularly as spreads in public markets have begun to widen from historically tight levels.
Finally, the quarter reignited a broader debate about the future path of inflation. Optimism around productivity gains from artificial intelligence and technological investment continues to build, but those potential benefits must now be weighed against the inflationary pressure of higher energy costs. Whether efficiency gains and the near-term economic activity driven by the AI build out can offset the economic drag of sustained elevated oil prices remains an open question.
Download the PDF to continue reading this quarter's commentary.
CLICK HERE
Davidson Investment Advisors, Inc. is a SEC registered investment advisor. The opinions expressed herein are those of Davidson Investment Advisors and are subject to change.
The information contained in this presentation has been taken from trade and statistical services and other sources, which we believe to be reliable. We do not guarantee that this information is accurate or complete and it should not be relied upon as such.
This presentation is for informational and illustrative purposes and is not intended to meet the objectives or requirements of any specific individual or account. Past performance is not an indicator of future results. Indices provide a general source of information on how various market segments and types of investments have performed in the past. An investor should assess his/her own investment needs based on his/her own financial circumstances and investment objectives.
The information on indices is presented for illustrative purposes only and is not intended to imply the potential performance of any fund or investment. Index performance assumes the reinvestment of all distributions, but does not assume any transaction costs, taxes, management fees, or other expenses. Indices are not available for direct investment.
The S&P 500® Index is a gauge of large-cap U.S. equities and serves as the foundation for a wide range of investment products. The index includes 500 leading companies and captures approximately 80% coverage of available market capitalization.
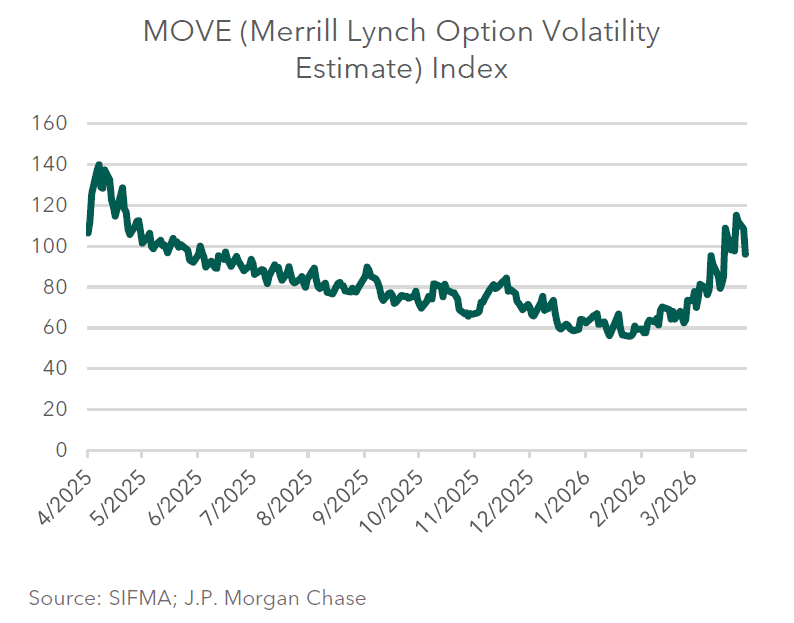
The MOVE Index (Merrill Lynch Option Volatility Estimate) is a measure of U.S. Treasury market volatility, often called the "VIX for bonds." It tracks implied volatility in Treasury options, signaling investor fear or certainty regarding interest rates. A high MOVE indicates high-rate uncertainty, while a low MOVE suggests stability.
The Russell 3000® Index is a capitalization-weighted stock market index that seeks to be a benchmark of the entire U.S. stock market.
The MSCI EAFE® Index is broadly recognized as the pre-eminent benchmark for U.S. investors to measure international equity performance. It comprises the MSCI country indexes capturing large and mid-cap equities across developed markets in Europe, Australasia and the Far East, excluding the U.S. and Canada. Numerous exchange-traded funds are based on the MSCI EAFE® Index, and the Chicago Mercantile Exchange, NYSE Liffe U.S. and the Bclear platform of Liffe are licensed to list futures contracts on this index as well.
The MSCI Emerging Markets® Index is a free-float weighted equity index that captures large and mid-cap representation across Emerging Market countries. The index covers approximately 85% of the free float-adjusted market capitalization in each country.
The Bloomberg Dollar Spot Index tracks the performance of a basket of 10 leading global currencies versus the U.S. Dollar. It has a dynamically updated composition and represents a diverse set of currencies that are important from trade and liquidity perspectives.