Davidson Investment Advisors’ third-quarter commentary provides insights into the U.S. equity, taxable fixed income, municipal fixed income, and international equities markets.
U.S. Municipal Fixed Income Market
A Challenging Quarter − A More Compelling Market
Through the end of third quarter 2026, the Bloomberg BVAL Muni AAA Callable Curve rose an average 118 basis points across one- to thirty-year maturities. Nearly all of that move occurred during the quarter, when yields increased 122 basis points on average. The sharp selloff produced the second-worst quarterly result for the Bloomberg 1-15 Year Municipal Bond Index since data began in December 2001: a 5.1% decline. September accounted for most of the damage, with the index falling 3.7%, its worst monthly return in at least a decade. Many bonds also slipped below their de minimis threshold, adding pressure to prices.
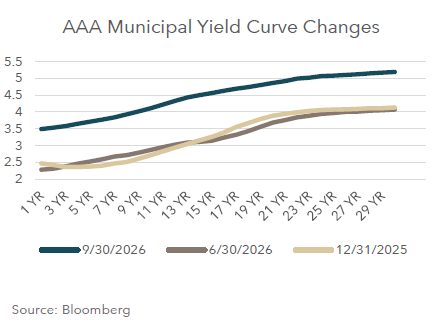
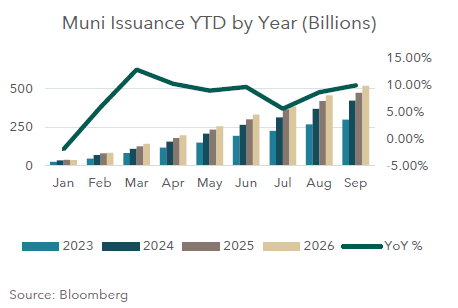
Treasury weakness explains only part of the move. Across the same maturities, Treasury yields rose about 76 basis points during the quarter, substantially less than municipal yields. Elevated new-issue supply remained the market’s defining theme. September issuance was nearly 20% above its year-earlier level, and year-to-date supply through September was almost 10% higher than in 2025, itself a heavy issuance year. Although several deals were postponed late in the quarter, higher borrowing costs did not materially deter issuers. Catch-up financing for delayed infrastructure projects remained an important source of issuance. Persistent supply periodically left dealers and investors absorbing a crowded calendar.
Heavy supply was compounded by the growing number of bonds trading below de minimis. For buyers whose purchase price creates market discount above the de minimis limit, gain up to accrued market discount generally faces ordinary income tax on sale or redemption. Other appreciation may qualify as capital gain. Buyers therefore demanded additional yield compensation, further weakening prices. Demand nevertheless remained resilient through much of the year, supported by inflows into mutual funds and separately managed accounts. That pattern continued through July and August but reversed in September as mutual funds began experiencing outflows. During the second half of the month, many investors appeared reluctant to add exposure until municipal yields stabilized, reducing liquidity as the selloff accelerated.
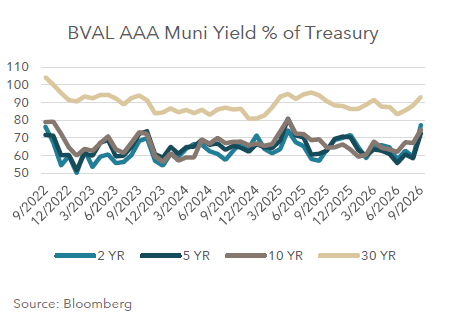
The speed of the adjustment left little time for coupon income to offset price declines. However, the reset has made municipal yields considerably more attractive, both in absolute terms and relative to Treasuries. Muni-to-Treasury yield ratios across most maturities are at their 2026 highs. Further increases could attract crossover buyers, who typically enter when tax-exempt yields compare favorably with taxable alternatives. The municipal curve has also flattened from its early-year profile, and the spread between 10-year and two-year yields has stopped widening. Intermediate maturities now offer broader opportunities: although the 15- to 20-year range remains compelling, investors can also find attractive income in the seven- to 12-year portion of the curve. This improved valuation backdrop should support demand once volatility eases, though a still-heavy issuance calendar may continue to test market capacity.
Download the PDF to continue reading this quarter's commentary.
CLICK HERE
Davidson Investment Advisors is an SEC-registered investment adviser. Registration does not imply a certain level of skill or training. The opinions expressed herein are those of Davidson Investment Advisors and are subject to change without notice.
The information contained in this presentation has been obtained from trade and statistical services and other sources believed to be reliable. Davidson Investment Advisors does not guarantee its accuracy or completeness, and the information should not be relied upon as such.
This presentation is for informational, educational, and illustrative purposes only and is not intended to address the objectives or requirements of any specific individual or account. It does not constitute investment advice or a recommendation and should not be viewed as a suggestion or call to action to make or refrain from making a particular investment decision. Investors should evaluate their investment needs based on their own financial circumstances and objectives.
The information on indices is presented for illustrative purposes only and is not intended to imply the potential performance of any fund or investment. Quoted total returns assume reinvested distributions. Price-index charts exclude reinvested dividends. Index results exclude transaction costs, management fees and other expenses. Indices are not available for direct investment.
The S&P 500® Index measures large-cap U.S. equities across 500 leading companies. Its sector indices group constituents by industry sector. The Russell 1000®, Russell 2000® and Russell 3000® indices measure large-cap, small-cap and broad U.S. equity performance, respectively.
U.S. Treasury yields represent market yields on U.S. government securities and are commonly used as benchmarks for fixed income markets. Yield and yield-curve data are shown for informational purposes only and are not total-return measures.
The MSCI EAFE® Index covers large- and mid-cap equities in developed markets outside the U.S. and Canada. The MSCI Emerging Markets® Index covers large- and mid-cap equities in emerging markets. The Korea Composite Stock Price Index (KOSPI) is a market capitalization-weighted index of common stocks on the Korea Exchange’s main stock market.
Nominal gross domestic product (GDP) is the total monetary value of all final goods and services produced within a country’s borders, measured at current market prices.
The Personal Consumption Expenditures (PCE) price index is a measure of the average change in prices paid for domestic goods and services by U.S. consumers. Compiled monthly by the Bureau of Economic Analysis (BEA), it tracks inflation and cost-of-living changes across a broad range of household and non-profit expenditures.
The Bloomberg Dollar Spot Index tracks the U.S. dollar against a basket of leading global currencies, with weights reflecting trade and liquidity. Its composition is reviewed annually.
The Bloomberg 1–15 Year Municipal Bond Index measures investment-grade, tax-exempt U.S. municipal bonds in the intermediate maturity segment.
Bloomberg BVAL (Bloomberg Valuation) municipal AAA curves are evaluated yield benchmarks. The AAA callable curve assumes a 5% coupon, non-call yields through year 10 and callable yields thereafter, quoted as offer-side yields to worst. A muni-to-Treasury ratio is the municipal yield divided by the Treasury yield of comparable maturity, multiplied by 100. Results depend on the curves and observation times used.
Global 10-Year Yields shows sovereign bond yields at approximately ten-year maturities, in percent. Brazil (USD) denotes U.S.-dollar denominated debt. Yield comparisons reflect differences in currency, credit risk and security characteristics. Yields and yield curves are not total-return measures.
Nominal gross domestic product (GDP) measures economic output at current prices, without adjusting for inflation. GDP growth is shown year over year (YoY), with a four-quarter average of YoY growth. Core personal consumption expenditures (PCE) inflation is the YoY change in the PCE price index excluding food and energy.
Municipal issuance is cumulative year-to-date (YTD) bond issuance in U.S. dollars, in billions. The YoY line compares each YTD total with the same period a year earlier. One basis point equals 0.01 percentage point. Price-index levels exclude reinvested dividends and can differ from quoted total returns.